Since the pandemic the Onondaga County housing market has been defined by scarcity: limited choices, intense competition, and buyers under pressure to make decisions quickly. Micron’s investment has added another concern for people hoping to buy here: whether future growth will keep pushing prices further beyond the reach of local households.
September’s housing data introduce a meaningful change to that conversation.
September 2026: The Key Numbers
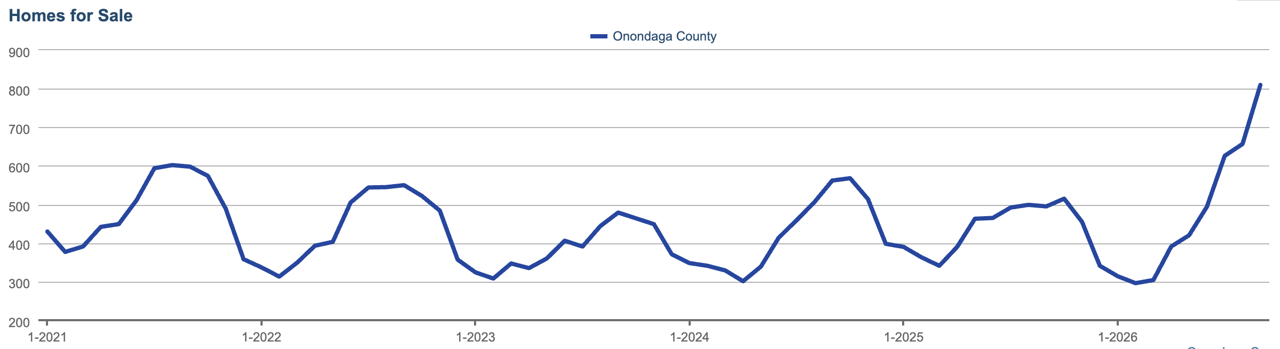
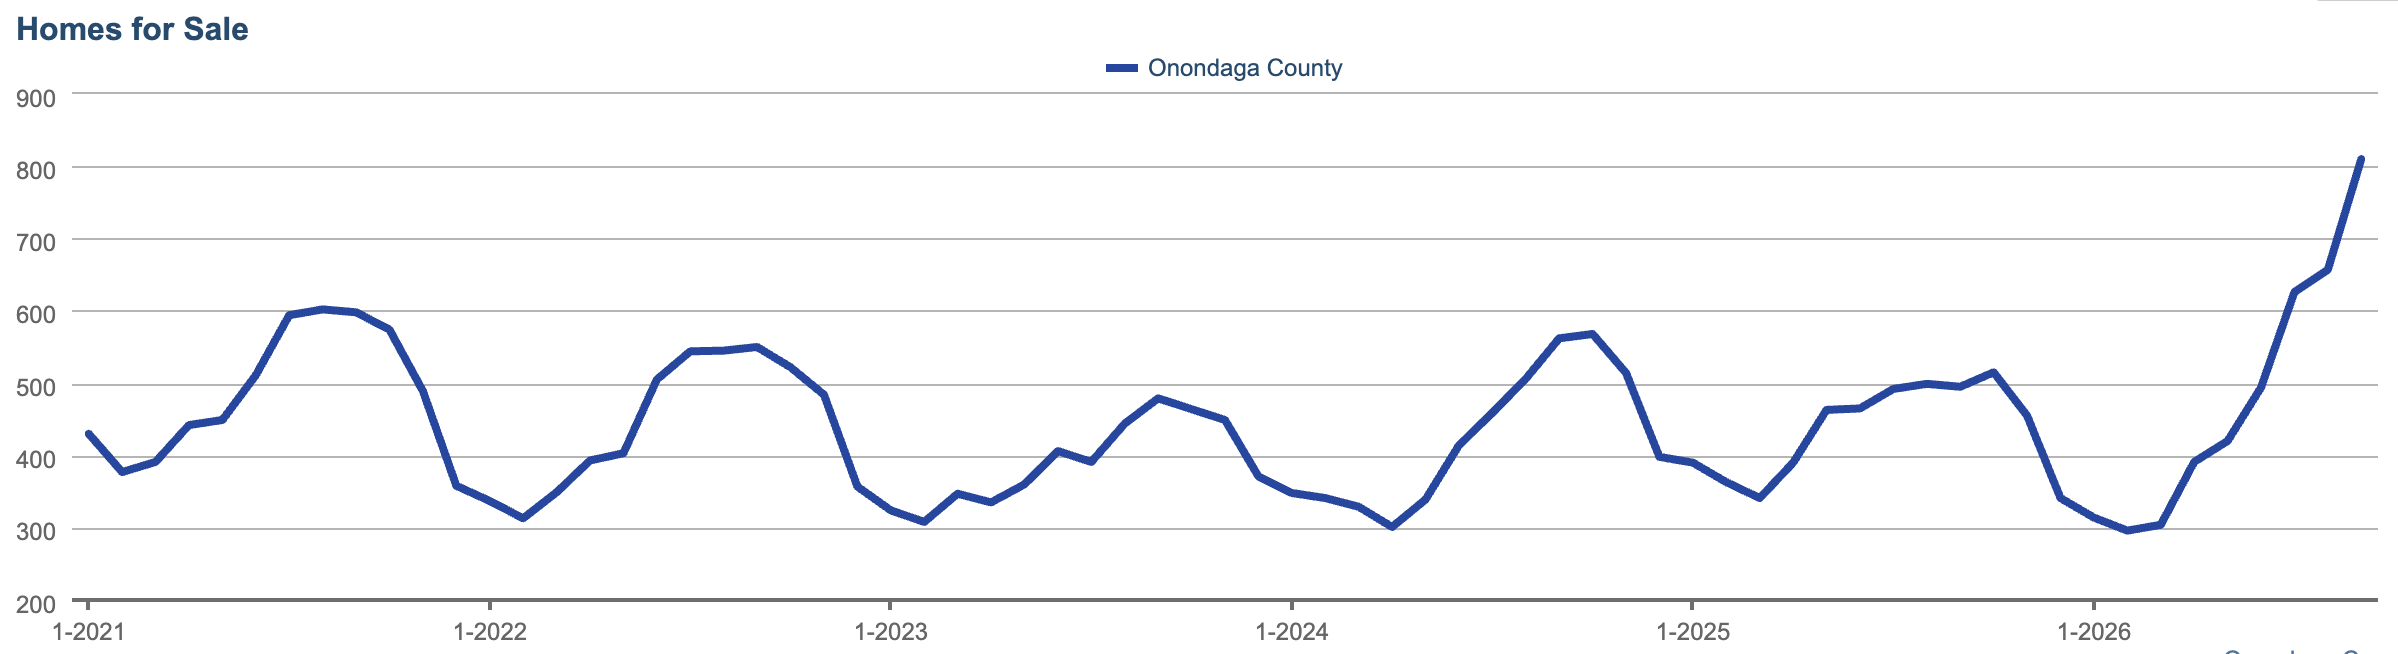
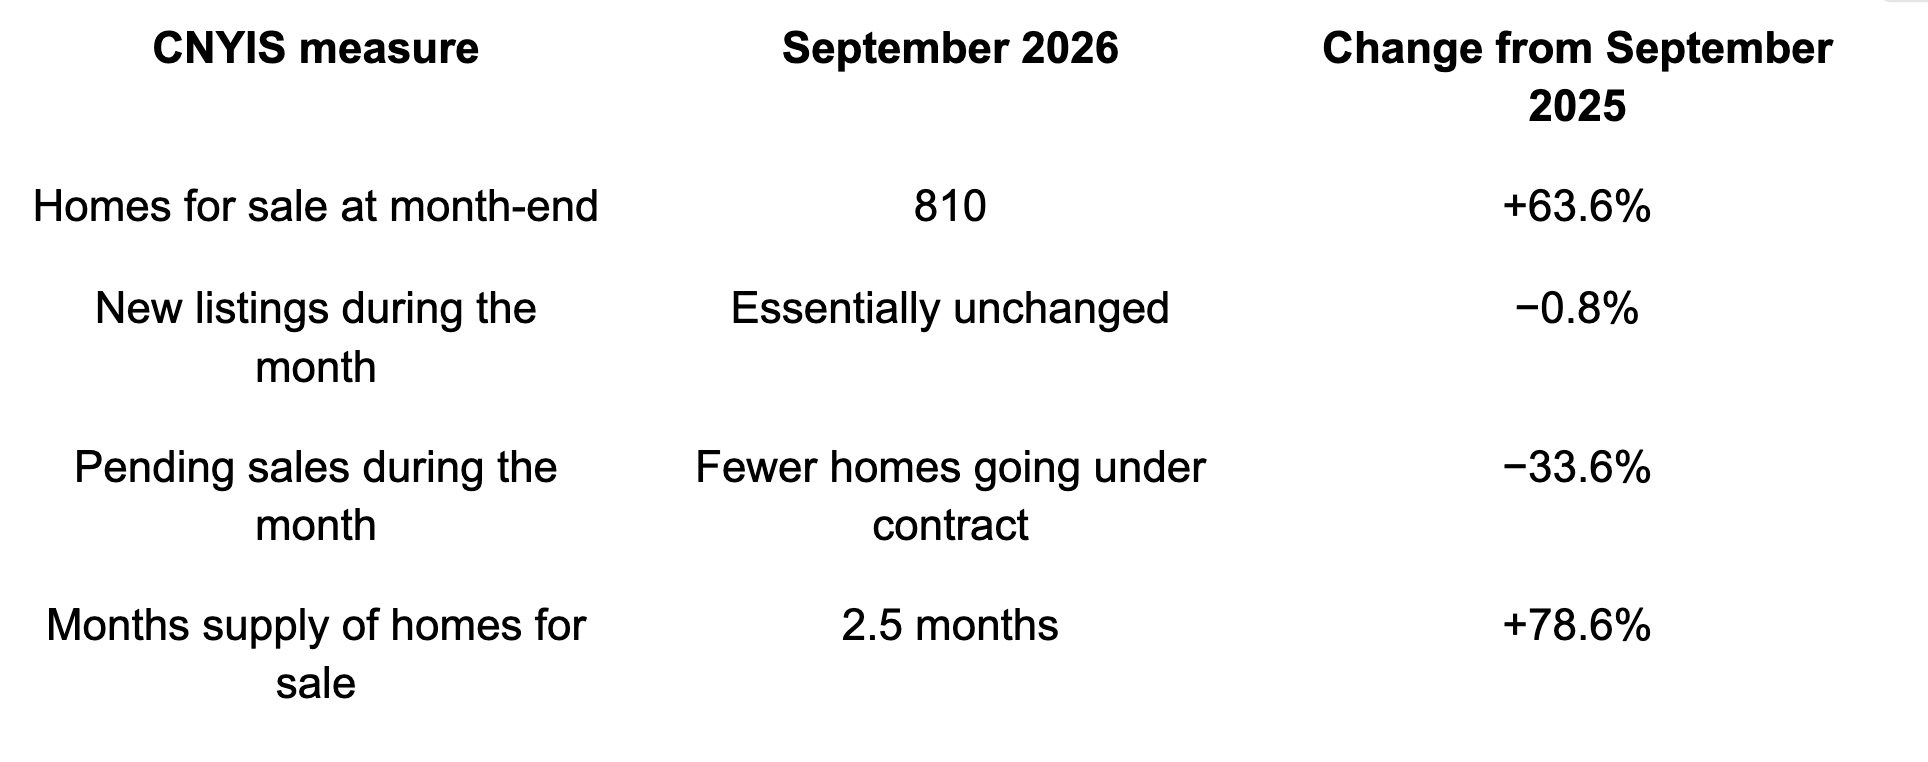
According to CNYIS, Central New York Information Systems, there were 810 homes for sale in Onondaga County at the end of September 2026, up 63.6% from a year earlier and the highest inventory since December 2019. Months supply reached 2.5 months, up 78.6%, and the highest reading since October 2019.
Those are substantial increases.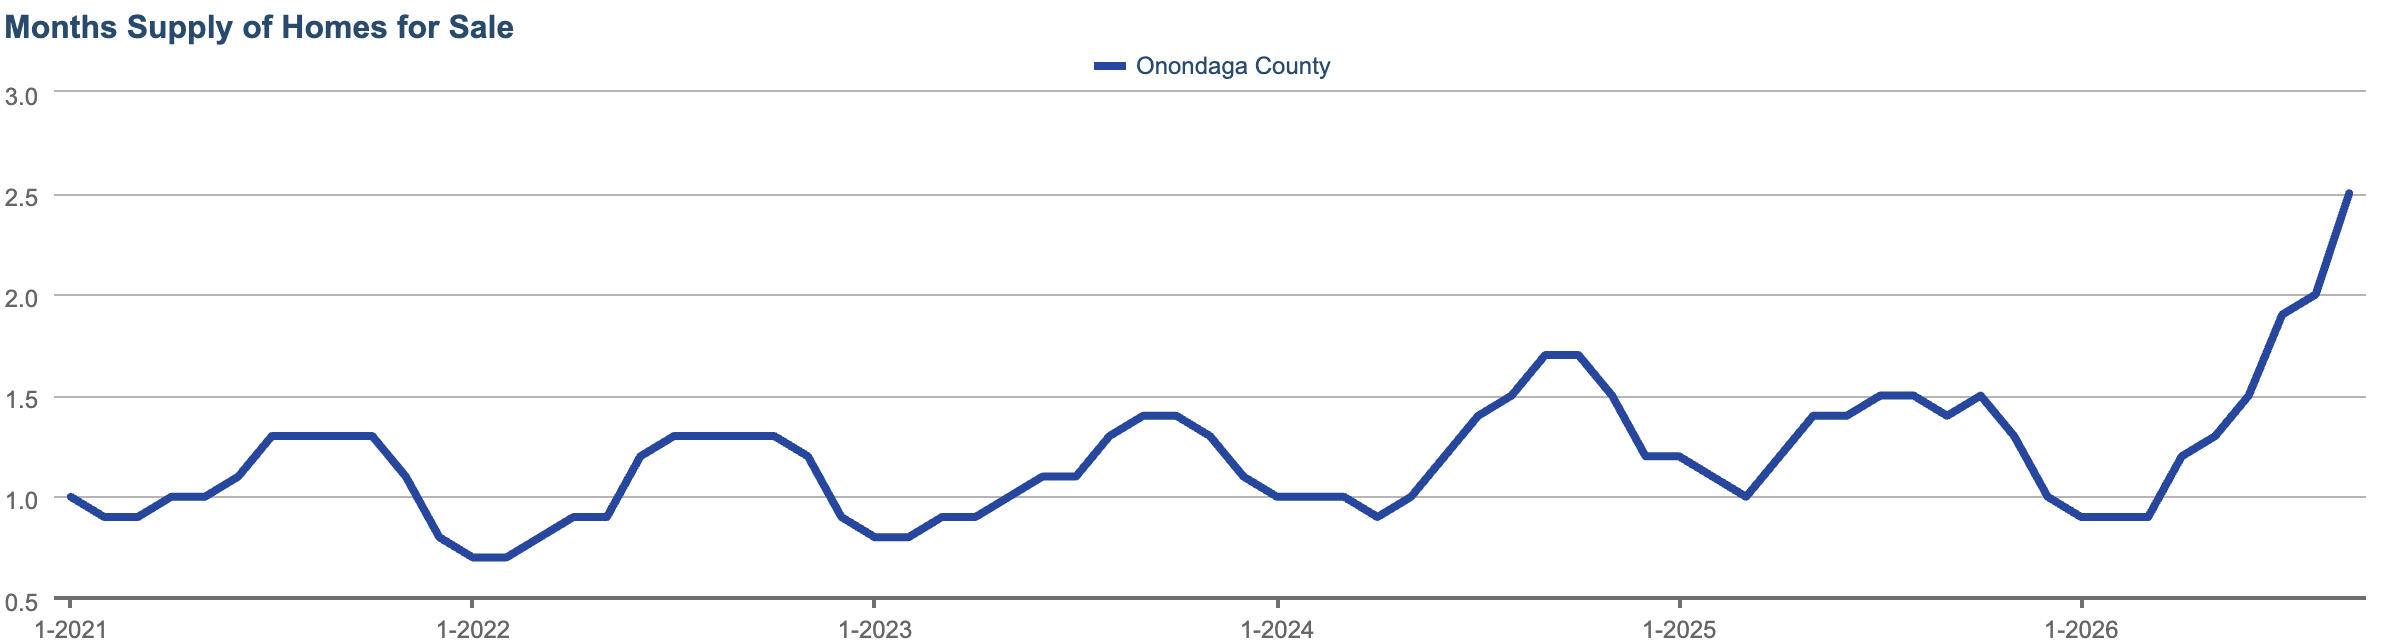
The September data shows that homes are being absorbed less quickly at prevailing prices and financing costs. That can change the balance of negotiating power before it produces a clear change in closed-sale prices.
Why Inventory Is Rising Without a Surge in New Listings
Inventory is the number of homes still available for purchase. New listings measure homes entering the market. Pending sales measure homes going under contract during the reporting period. These describe different parts of the process.[1]
A market can accumulate inventory even when the flow of new listings barely changes. If fewer buyers sign contracts, more listings remain available and compete with the next group of homes offered for sale. Withdrawals, expired listings, and properties returning after failed contracts can also affect the total.
That is why September’s nearly flat new-listing count and 33.6% decline in pending sales deserve to be read together. The month’s evidence points more toward slower absorption than a sudden surge of new sellers.
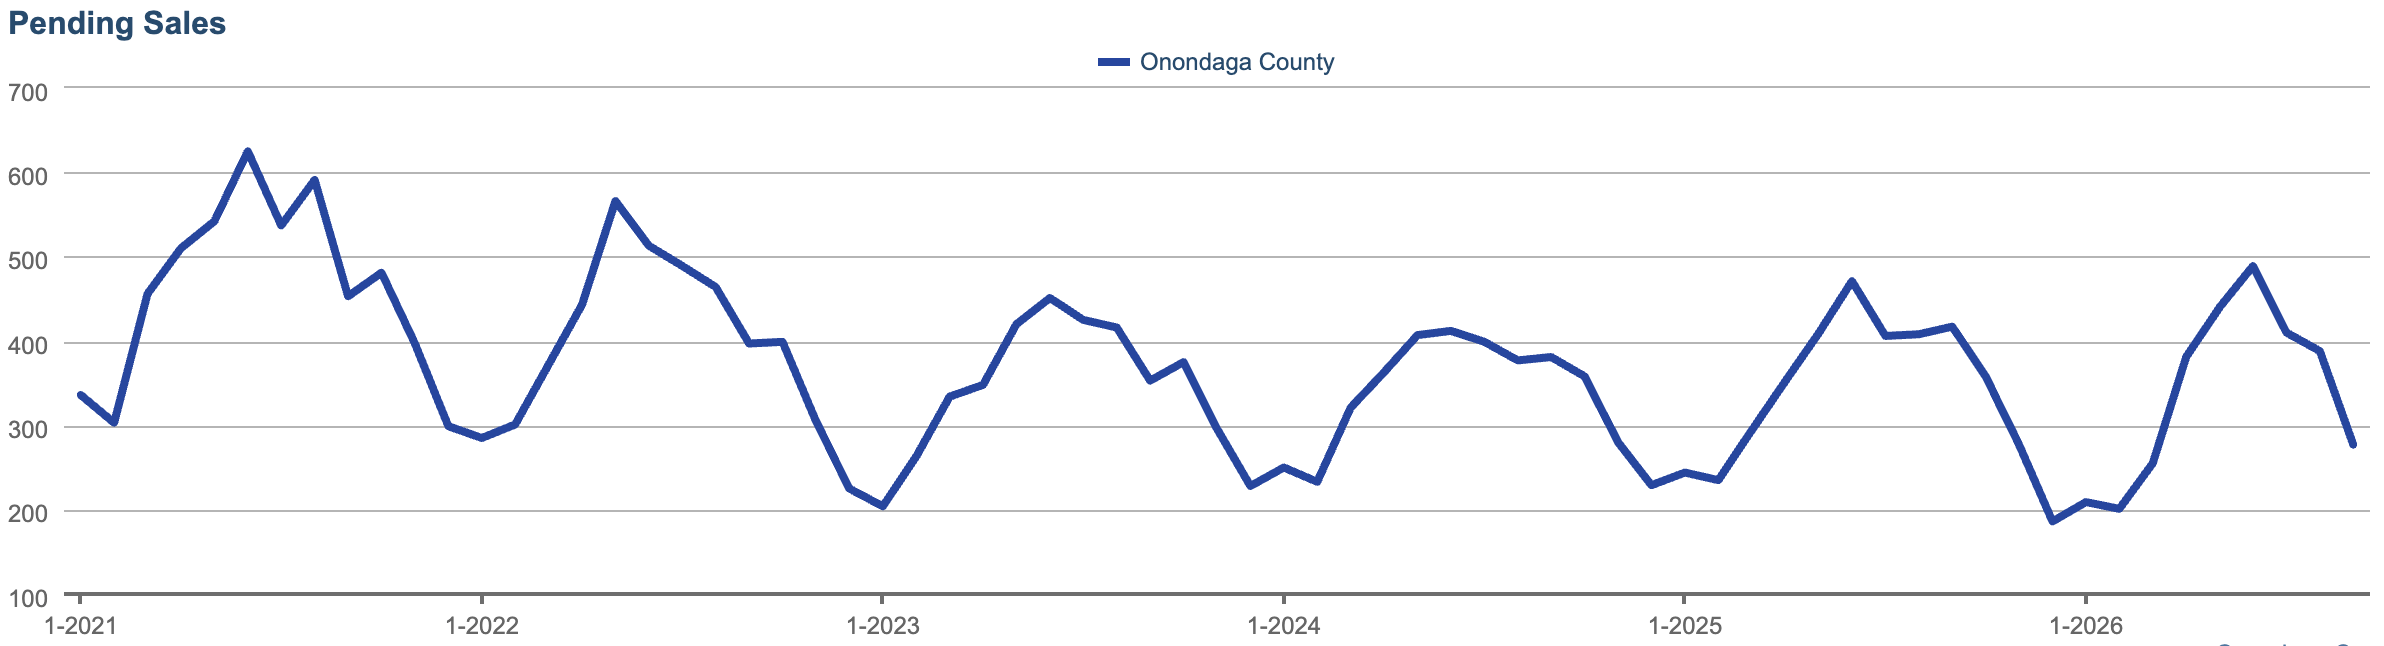
There is an important qualification: September’s new listings do not explain the entire year’s inventory buildup. The data shows inventory rising earlier in 2026 and accelerating in late summer. Listing activity also appears stronger than a year earlier during parts of spring and summer. Earlier inflows can contribute to today’s available inventory even when September’s inflow is flat.
The useful conclusion is that the relationship between available homes and buyers signing contracts has shifted. The four headline figures do not establish a single cause for that shift.
More Choice, but Still Limited Supply
The seasonal context makes the change more interesting. Contract activity normally slows as summer ends, so a decline from July to September would not be surprising by itself. But these comparisons are against September of the previous year, which accounts for much of the usual seasonal pattern. The inventory chart also shows an unusually strong late-summer buildup relative to the patterns visible in recent years. Seasonality remains relevant, but it does not adequately explain away the year-over-year changes.
The size of the increase needs context, too. The reported percentages imply approximately 495 available homes a year earlier, compared with 810 now: roughly 315 additional choices across the county. Last September’s months supply was approximately 1.4 months. Both comparisons start from exceptionally tight conditions.
Moving from extraordinary scarcity toward greater choice is a meaningful development. It is still too soon to declare a countywide buyer’s market. For context, the National Association of Realtors describes roughly five to six months of supply as a conventional benchmark for a more balanced market.[8] That is a broad reference point, with different calculation methods and local conditions affecting interpretation. At 2.5 months, the county’s supply remains relatively lean even as buyers gain alternatives.
Months supply relates available inventory to the pace of sales activity. It is partly another view of the same inventory-and-absorption relationship, rather than an entirely independent signal. Its calculation can also smooth recent activity: InfoSparks’ standard definition uses average monthly pending sales over the preceding 12 months.[1] A sharp slowdown in current contracts can therefore take time to work fully through that denominator.
Nor does 2.5 months mean a particular house will take two and a half months to sell. A well-positioned home might attract immediate interest, while a property with fewer suitable buyers could remain available much longer.
Similarly, reaching a 2019 inventory level does not recreate the 2019 housing market. Today’s prices, financing costs, household budgets, and expectations differ. The historical comparison tells us how unusual the inventory count has become, not what homes should now be worth.
Affordability and the Local Economy
Affordability is an especially important part of the explanation.
Freddie Mac’s national average 30-year fixed mortgage rate rose from 6.71% on September 3 to 7.03% on September 24. The September 24 reading was also above the 6.30% average reported a year earlier.[2][3] By October 8, the average had reached 7.40%, adding further financing pressure as the market entered October.[4]
Consider an illustrative buyer purchasing a $350,000 home with 20% down and a $280,000, 30-year mortgage. At 6.30%, principal and interest are approximately $1,733 per month. At 7.03%, they are approximately $1,868. That is about $135 more each month for the same house and loan balance, before property taxes and insurance.
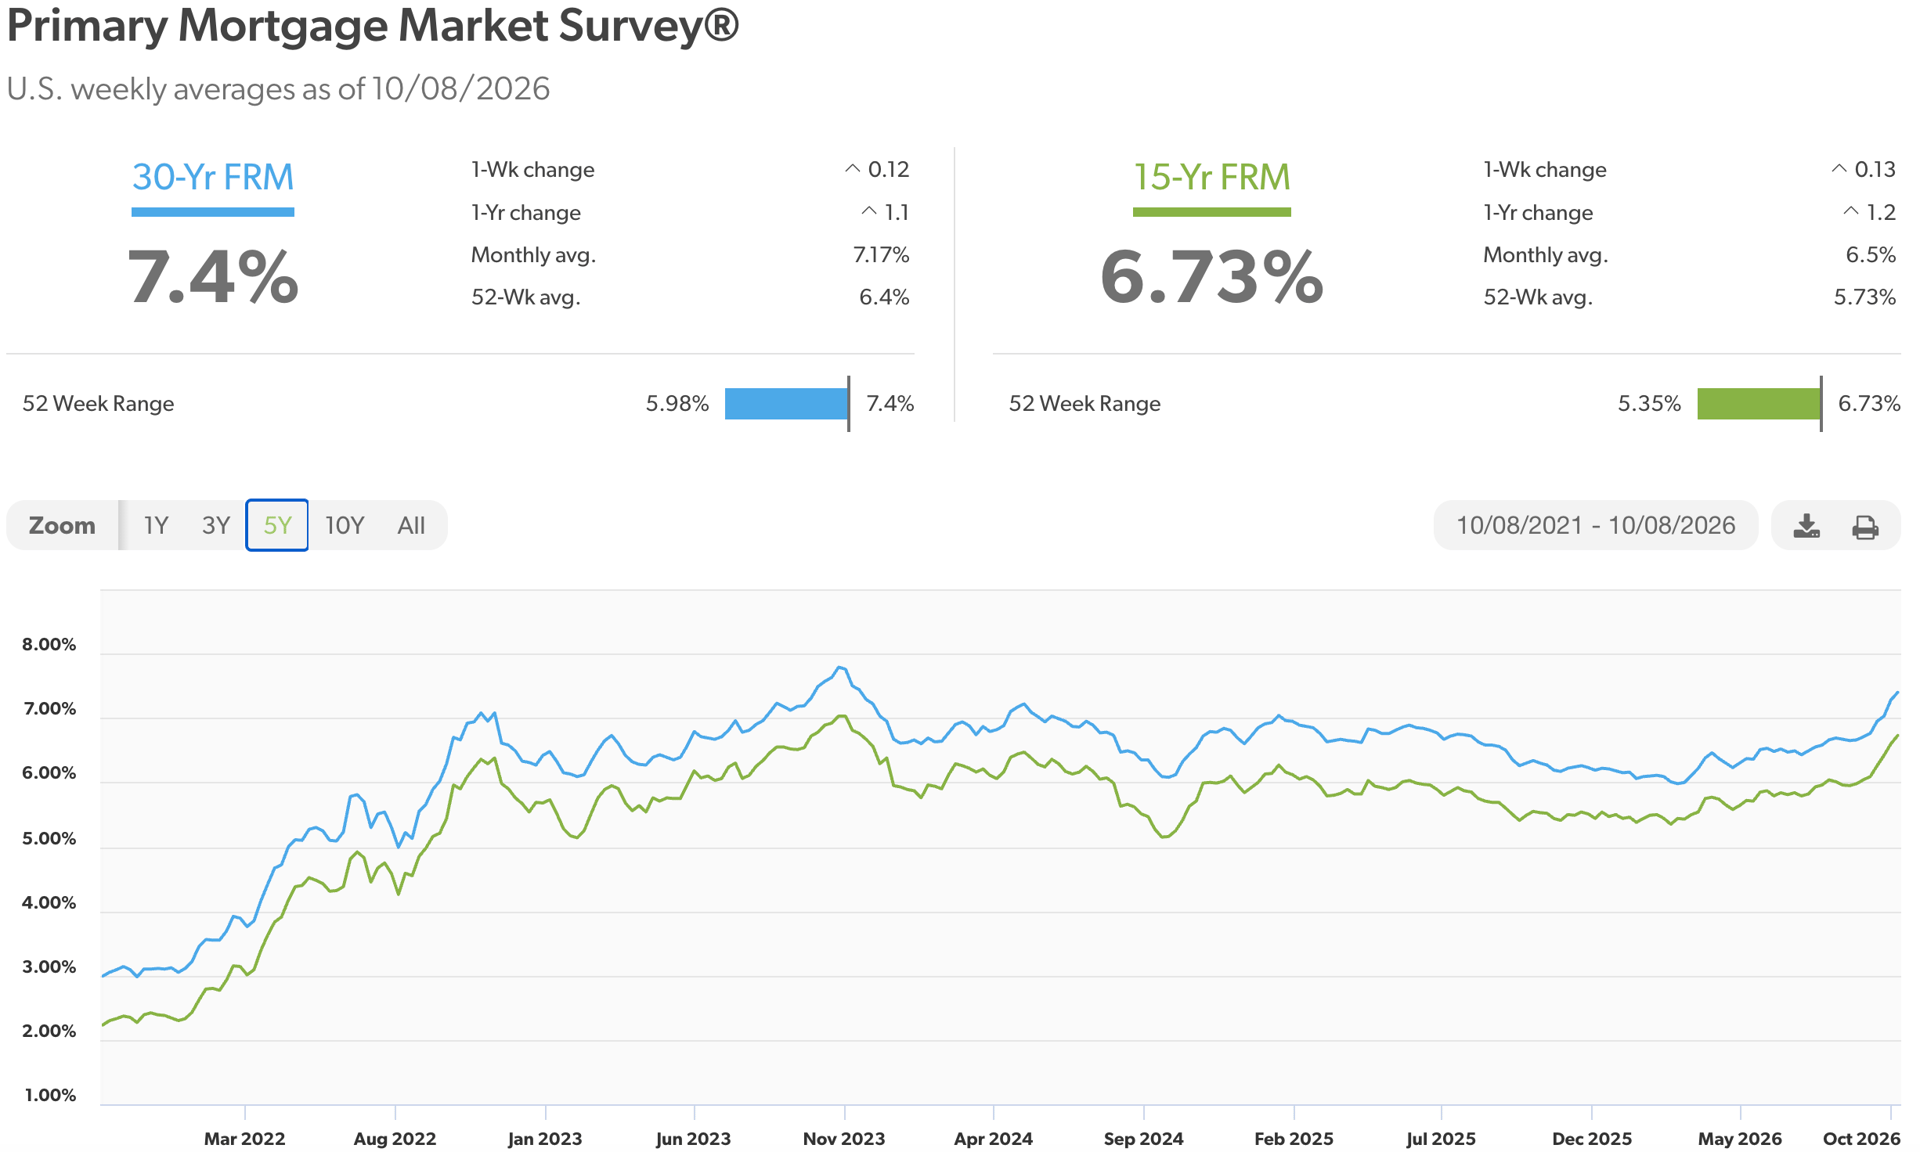
Buyers may have more alternatives while having less capacity to meet sellers’ asking prices. That can show up as fewer contracts, more negotiation, or longer exposure before it appears as a lower sale price.
The timing of rising rates is consistent with affordability contributing to the slowdown. It does not prove that rates explain all of the decline. These aggregate figures cannot separate financing pressure from pricing, employment conditions, changes in the mix of available homes, or reporting effects.
The broader local economy also adds useful context. The New York State Department of Labor reported that Syracuse metropolitan-area private employment was down 2,300 jobs, or 0.9%, in August 2026 compared with a year earlier.[5] This covers a broader geography than Onondaga County and measures jobs, not homebuyers. It is nevertheless a reminder that future investment plans and current employment conditions are different measures. A modest employment decline may affect confidence and purchasing capacity, but it does not independently establish the cause of September’s housing slowdown.
How Micron Fits Into the Housing Outlook
Micron remains a major part of the region’s long-term outlook. The company broke ground on its Clay project in January 2026 and announced its first concrete pour in July. Its January announcement anticipated production beginning in 2030, followed by a ramp-up through the decade.[6][7]
The housing implications will unfold over time. Construction workers, permanent employees, suppliers, and other businesses can create different types of demand. Some people will rent; some will buy; some will already live in the region. Employment projections cannot simply be translated into an equal number of immediate home purchases.
The effect on prices will also depend on how much housing becomes available, where it is located, and what households can afford. A major investment can support regional growth while individual housing segments experience slower sales or price adjustments along the way.
For buyers worried that Micron makes waiting unaffordable, September is a useful reminder to evaluate the homes and competition in front of them. For sellers, future regional growth should inform the outlook, while current buyer behavior should inform today’s asking price.
The distinction matters for community affordability as well. An increase in homes listed for sale does not necessarily represent an increase in the number of homes that physically exist. Existing properties can accumulate in MLS inventory because buyers cannot comfortably afford them. Long-term affordability still depends on housing additions, the types and prices of those homes, household incomes, and borrowing costs. September’s inventory increase offers potential breathing room for buyers; it does not establish that the region’s housing needs have been met.
What Is Too Soon to Tell About Home Prices
Prices can be slow to adjust for other reasons, too. Sellers may first hold their asking prices, then offer concessions, reduce the price, or withdraw the property. Those choices influence how much of the slowdown becomes an actual decline in transaction prices.
A monthly median sale price also reflects which homes sold. If more expensive properties account for a larger share of closings, the median could rise while negotiating conditions soften. If less expensive homes account for more sales, the median could fall without every comparable property losing value. Changes in comparable-home pricing and seller concessions provide a clearer picture than a countywide median alone.
At this point, the data support a slowdown in contract activity and an increase in available choices. They do not yet tell us whether the change will persist, how broadly it extends across the county, or how much prices might adjust. A 33.6% decline in pending sales is a decline in transaction activity, not an estimate of a decline in property values.
The Data to Watch Next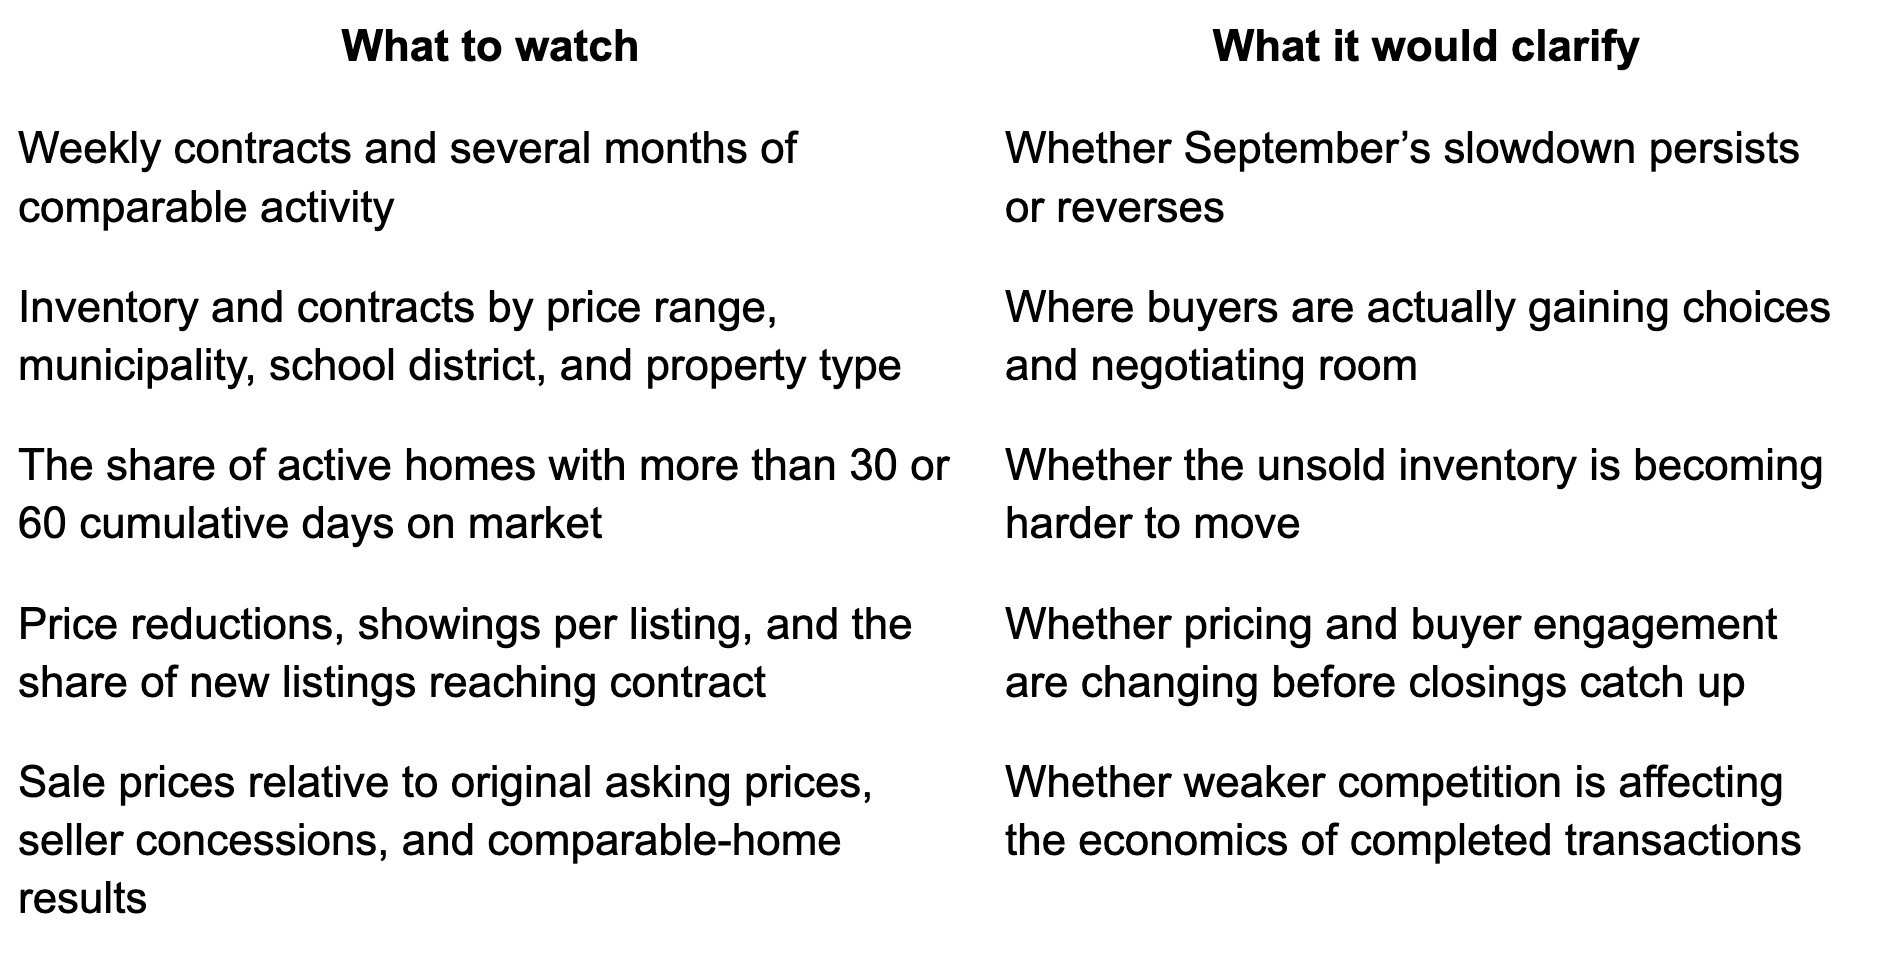
What This Means for Buyers
For buyers, the practical opportunity is greater selectivity. More available homes can mean more room to compare alternatives, investigate condition, and negotiate price or terms where property-specific competition permits. That opportunity may be most evident among homes with longer exposure, condition concerns, or asking prices that buyers have resisted.
The countywide data still cannot tell a buyer that every desirable home will be available at a discount. The right question is how many credible alternatives exist within that buyer’s budget and location requirements, and how quickly similar homes are going under contract. A purchase should work within the household’s current budget and expected ownership period without relying on future appreciation or a lower refinancing rate.
What This Means for Sellers
For sellers, the priority is to price against today’s alternatives and buyer response. Recent closed comparables remain important, but they should be considered alongside current competing listings, recent pending activity, reductions, and showing feedback. A spring sale negotiated under tighter conditions may be less informative if buyers now have several comparable options.
Preparation, presentation, and a clear explanation of a home’s advantages become more valuable as choices expand. Weak response should prompt an early review of price, condition, and marketing. Waiting for older closed-sale statistics to confirm a shift can leave a seller reacting after competing properties have already adjusted.
If You Are Selling and Buying
Homeowners who plan to sell and buy should evaluate both sides together. Greater choice on the purchase side could offset some reduced negotiating leverage on the sale side. The outcome depends on the specific segments involved, financing, and timing, rather than the direction of a single countywide headline.

Sources
- ShowingTime MarketStats: definitions of new listings, active listings, pending sales, days on market, and months supply.
- Freddie Mac: Mortgage Rates Average 6.71%, September 3, 2026.
- Freddie Mac: Mortgage Rates Average 7.03%, September 24, 2026.
- Freddie Mac: Mortgage Rates Average 7.40%, October 8, 2026.
- New York State Department of Labor: Labor Statistics for the Central New York Region, August 2026 employment discussion.
- Micron: Official Groundbreaking at New York Megafab Site, January 16, 2026.
- Micron: First Concrete at New York Fab, July 9, 2026.
- National Association of Realtors: Home Prices Continue to Rise Despite Sales Slowdown, discussion of the conventional five- to six-month balanced-market benchmark.